
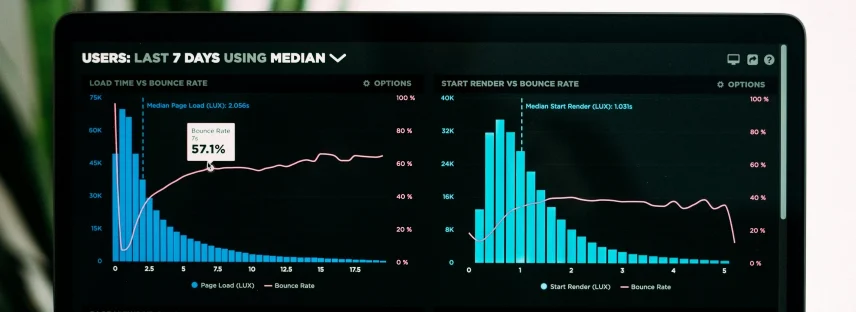
Dashboard Design Services
Most dashboard design is the easy version of this problem: six tiles, a line chart, a number that goes up. That is a summary screen, and it is not what this page is about.
The hard version is an interface somebody works inside all day. Thousands of rows. Several dimensions that matter at once. Filters that have to compose. A timeline that has to stay legible at a week and at two years. Drill-downs that need to remember where you came from. Data that is late, missing, or disputed, and an interface that has to say so without becoming unusable.
We design those, and we build the layer underneath them. Knowing how the query behaves at scale is not a design detail — it is the thing that decides whether an interaction is possible at all.
What We Design
Not every project needs all of this. These are the parts we go deep on when a product calls for them.
-
Information density
How much can be on screen before it stops being readable, and how to get more there anyway. Alignment, weight, spacing and restraint with colour, so a dense screen reads as organised rather than as noise.
-
Choosing the right representation
Which view actually answers the question — a table, a chart, a timeline, a map, or a single number with context. Most of the worst dashboards we are asked to fix are charts where a sorted table would have been better.
-
Filtering, scoping and state
Filters that combine predictably, scope that is always visible so nobody misreads a filtered number as a total, and state that survives a refresh and a shared link. The most common serious failure in operational tools is a user acting on a number they did not realise was filtered.
-
Drill-down and navigation
Moving from summary to detail and back without losing your place. Designed as a path, not as a set of disconnected screens.
-
Timelines and scheduling views
Interfaces where time is a primary axis, which brings its own problems — zoom levels, dependencies, overlap, and what to do when a bar is one pixel wide.
-
The states that matter most here
Loading in stages rather than all at once. Partial data labelled as partial. Stale data labelled as stale. No data distinguished from zero. On a data product these are not edge cases; they are most of a working week.
-
Reporting and export
The screen is not usually the last stop. Printing, PDF and export designed as outputs in their own right, since that is often what gets sent to the person who makes the decision.
-
Accessibility in data interfaces
Charts that do not rely on colour alone, tables that work with a screen reader and a keyboard, and contrast that holds at small sizes. Harder here than anywhere else, and skipped more often.
When Teams
Come to Us
-
A powerful product that nobody can read
The data is all there, the users cannot get at it, and the team has stopped being able to see the problem.
-
A reporting layer over an existing system
The backend holds the answers and there is no interface that surfaces them. Often pairs with data engineering and integrations.
-
Operational tools people live in
Scheduling, monitoring, logistics, compliance. Products where small design decisions are multiplied by eight hours a day.
-
It worked at demo scale
Designed against a hundred rows, deployed against a million. Both a design and a query problem, and we treat it as both.
-
Everyone wants a different view of the same data
An operations lead, an analyst and an executive need different things. The usual failure is one screen attempting all three.
Send Us the Product
Send us the product and a description of who uses it and for what. We will tell you what we would change and why, before anyone signs anything.
How We Work
What decisions this interface exists to support, and who makes them. Not “what metrics do you want” — what you do differently depending on the answer.
What actually exists, at what grain, how fresh, and how reliable. Design that ignores this produces screens nobody can build.
What lives on which screen, and the path between summary and detail.
Screens at real density with real volumes, including the loading, partial and stale states.
Tested with the people who will use it daily, because a dense interface reads very differently to its designer than to its user.
Specified for implementation, with us available while it becomes code.
Stack
- Design: Figma, with components built for density and real data volumes
- Charting: specified against whichever library the build will use, rather than drawn and hoped for
- Build targets: React and Next.js on web, React Native on mobile
- Data layer: designed alongside the backend where we are building that too
- Accessibility: non-colour encoding, keyboard and screen reader paths through tables and charts
Selected Work
- Planit. Construction planning and scheduling platform with 4D scheduling, built on structured data extracted from building models. A timeline interface over a genuinely complex domain, used by very large contractors and architecture practices downstream.
- Compliance Auditing Tool. Multi-role auditing platform with structured reporting over a configurable rule set.
Industries We Design For
Construction and PropTech is where this work goes deepest. We also design data interfaces for healthcare platforms, booking and scheduling systems, and travel and mobility.
How We
Work Together
-
Design only
A defined engagement with a documented handover, for a product you will build elsewhere or in house. -
Design and build
Interface and data layer from one team. On data products this is worth more than usual, because the two halves constrain each other constantly. -
Review of an existing interface
A shorter engagement ending in a written assessment of what to change and in what order. SeeWe price every project individually. There are no packages, because the work does not arrive in packages.
Questions We
Get Asked
-
Yes, and we will ask hard questions about the data early. A design that assumes a query the backend cannot answer quickly is a design that will be quietly changed during build, usually for the worse.
-
If your users are analysts and the tool does the job, probably not. If your users are not analysts, or the interface is part of your product rather than an internal report, a BI tool usually ends up being the thing people complain about.
-
Mostly by removing everything that is not answering a question, then using alignment, weight and spacing rather than colour and borders to organise what remains. Density is not the enemy. Undifferentiated density is.
-
Some of it, deliberately. Trying to make a full operational interface work on a small screen usually produces something that works nowhere. We design the subset that genuinely belongs on a phone and say so explicitly.
-
We give you a rough estimate once we understand the data and the decisions it supports. The detailed number comes after the scope is agreed, broken into modules.